Colorful Language: Data-driven Anthropology
2014
UX design, development
UX design, development
While interning at Fathom Information Design, I worked on a project dealing with the link between psychology, language, and color. I took inspiration from World Color Survey, an anthropological study conducted in the 1970s to understand how people name color across cultures and languages.
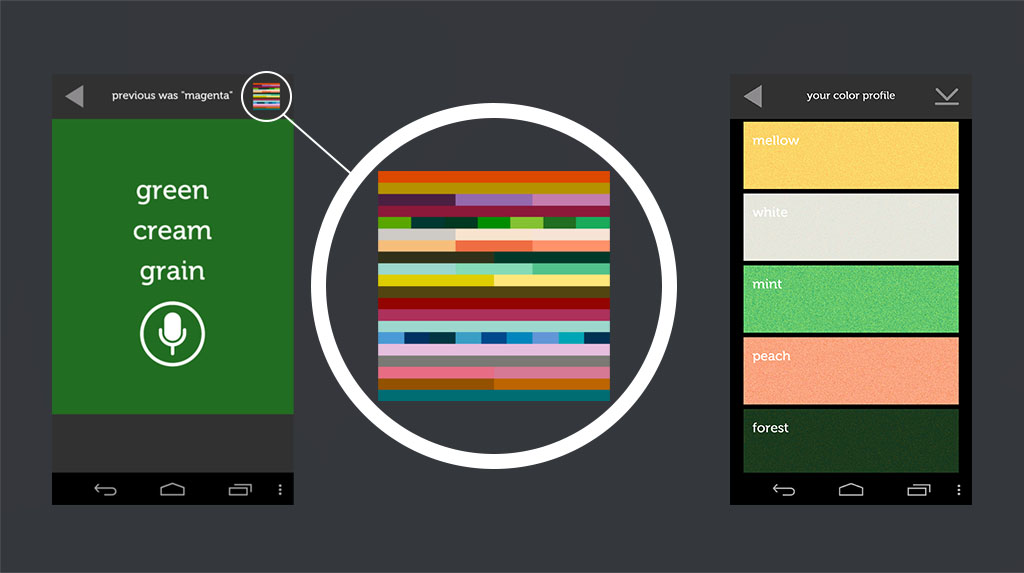
I built an updated form of the survey as an Android app with voice-input, using Processing and the Google Speech API.
I built an updated form of the survey as an Android app with voice-input, using Processing and the Google Speech API.
Comparing colors
The original survey identified how different groups of indigenous peoples named 330 colors in their respective languages, but with my Android app version I decided to stay within the English-speaking world. I anticipated that even within English, interesting comparisons would crop up depending on location, age, gender, and even individual-to-individual. Here you can see a comparison of the colors that my coworker Terrence and I gave the same name, and of similar colors that we gave different names.
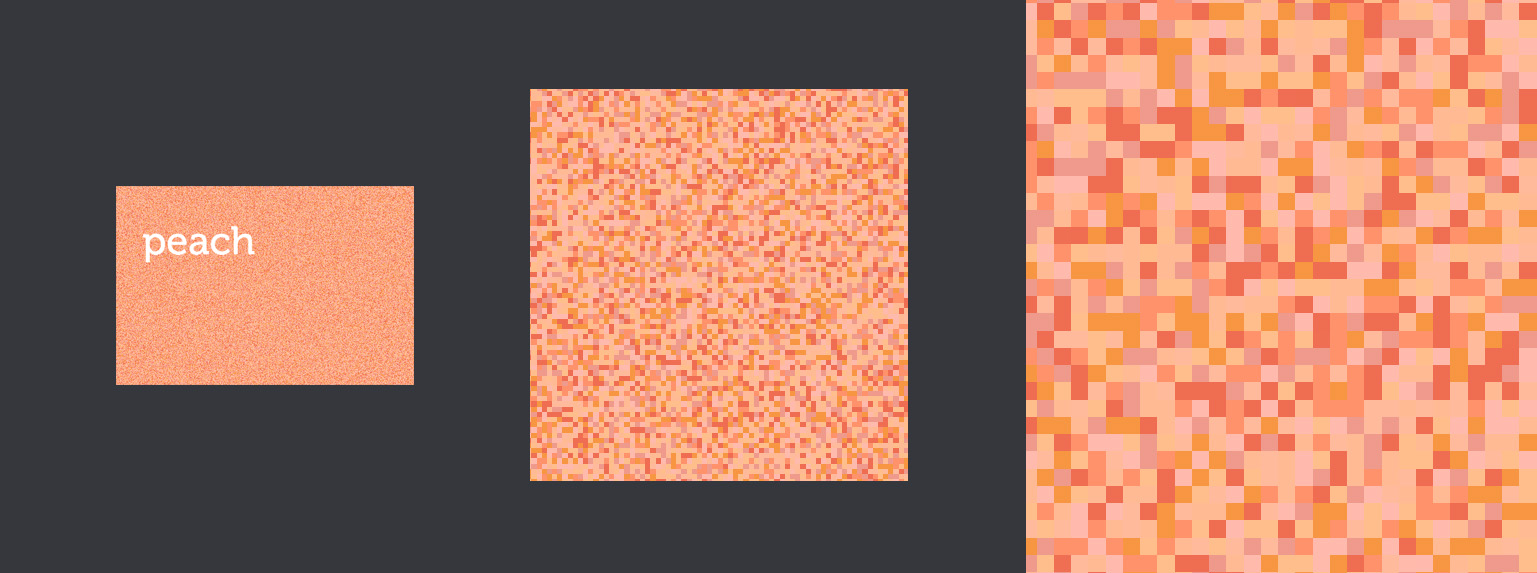
Your "Average Peach"
To create a visual average of, for example, the seven color samples you named "peach," I created a mosaic of pixels, each colored with one of the seven samples. Your eye averages out the different colored pixels to give an overall impression of what your average peach color looks like. The noisier the mosaic, the wider the range of colors you define as "peach".The user color profile displayed in the top-right corner of the app is similarly displayed, but in stacks of colors instead of square pixels.
Incentives & Fun
Staying true to the original World Color Survey, the app required that users name each of the 330 colors aloud, one at a time. The speech recognition made the survey a bit less painful and encouraged users to go with their first instinct, but it still definitely wasn't fun. I began experimenting with more compelling interactions, and prototyped the tetris-minesweeper-like color survey below using Processing.The board is set up using a 2-dimensional array of colored squares. The array is populated by grabbing colors that are within 9 columns of a randomly selected column in the Munsell Chart, producing an board of similarly colored squares.