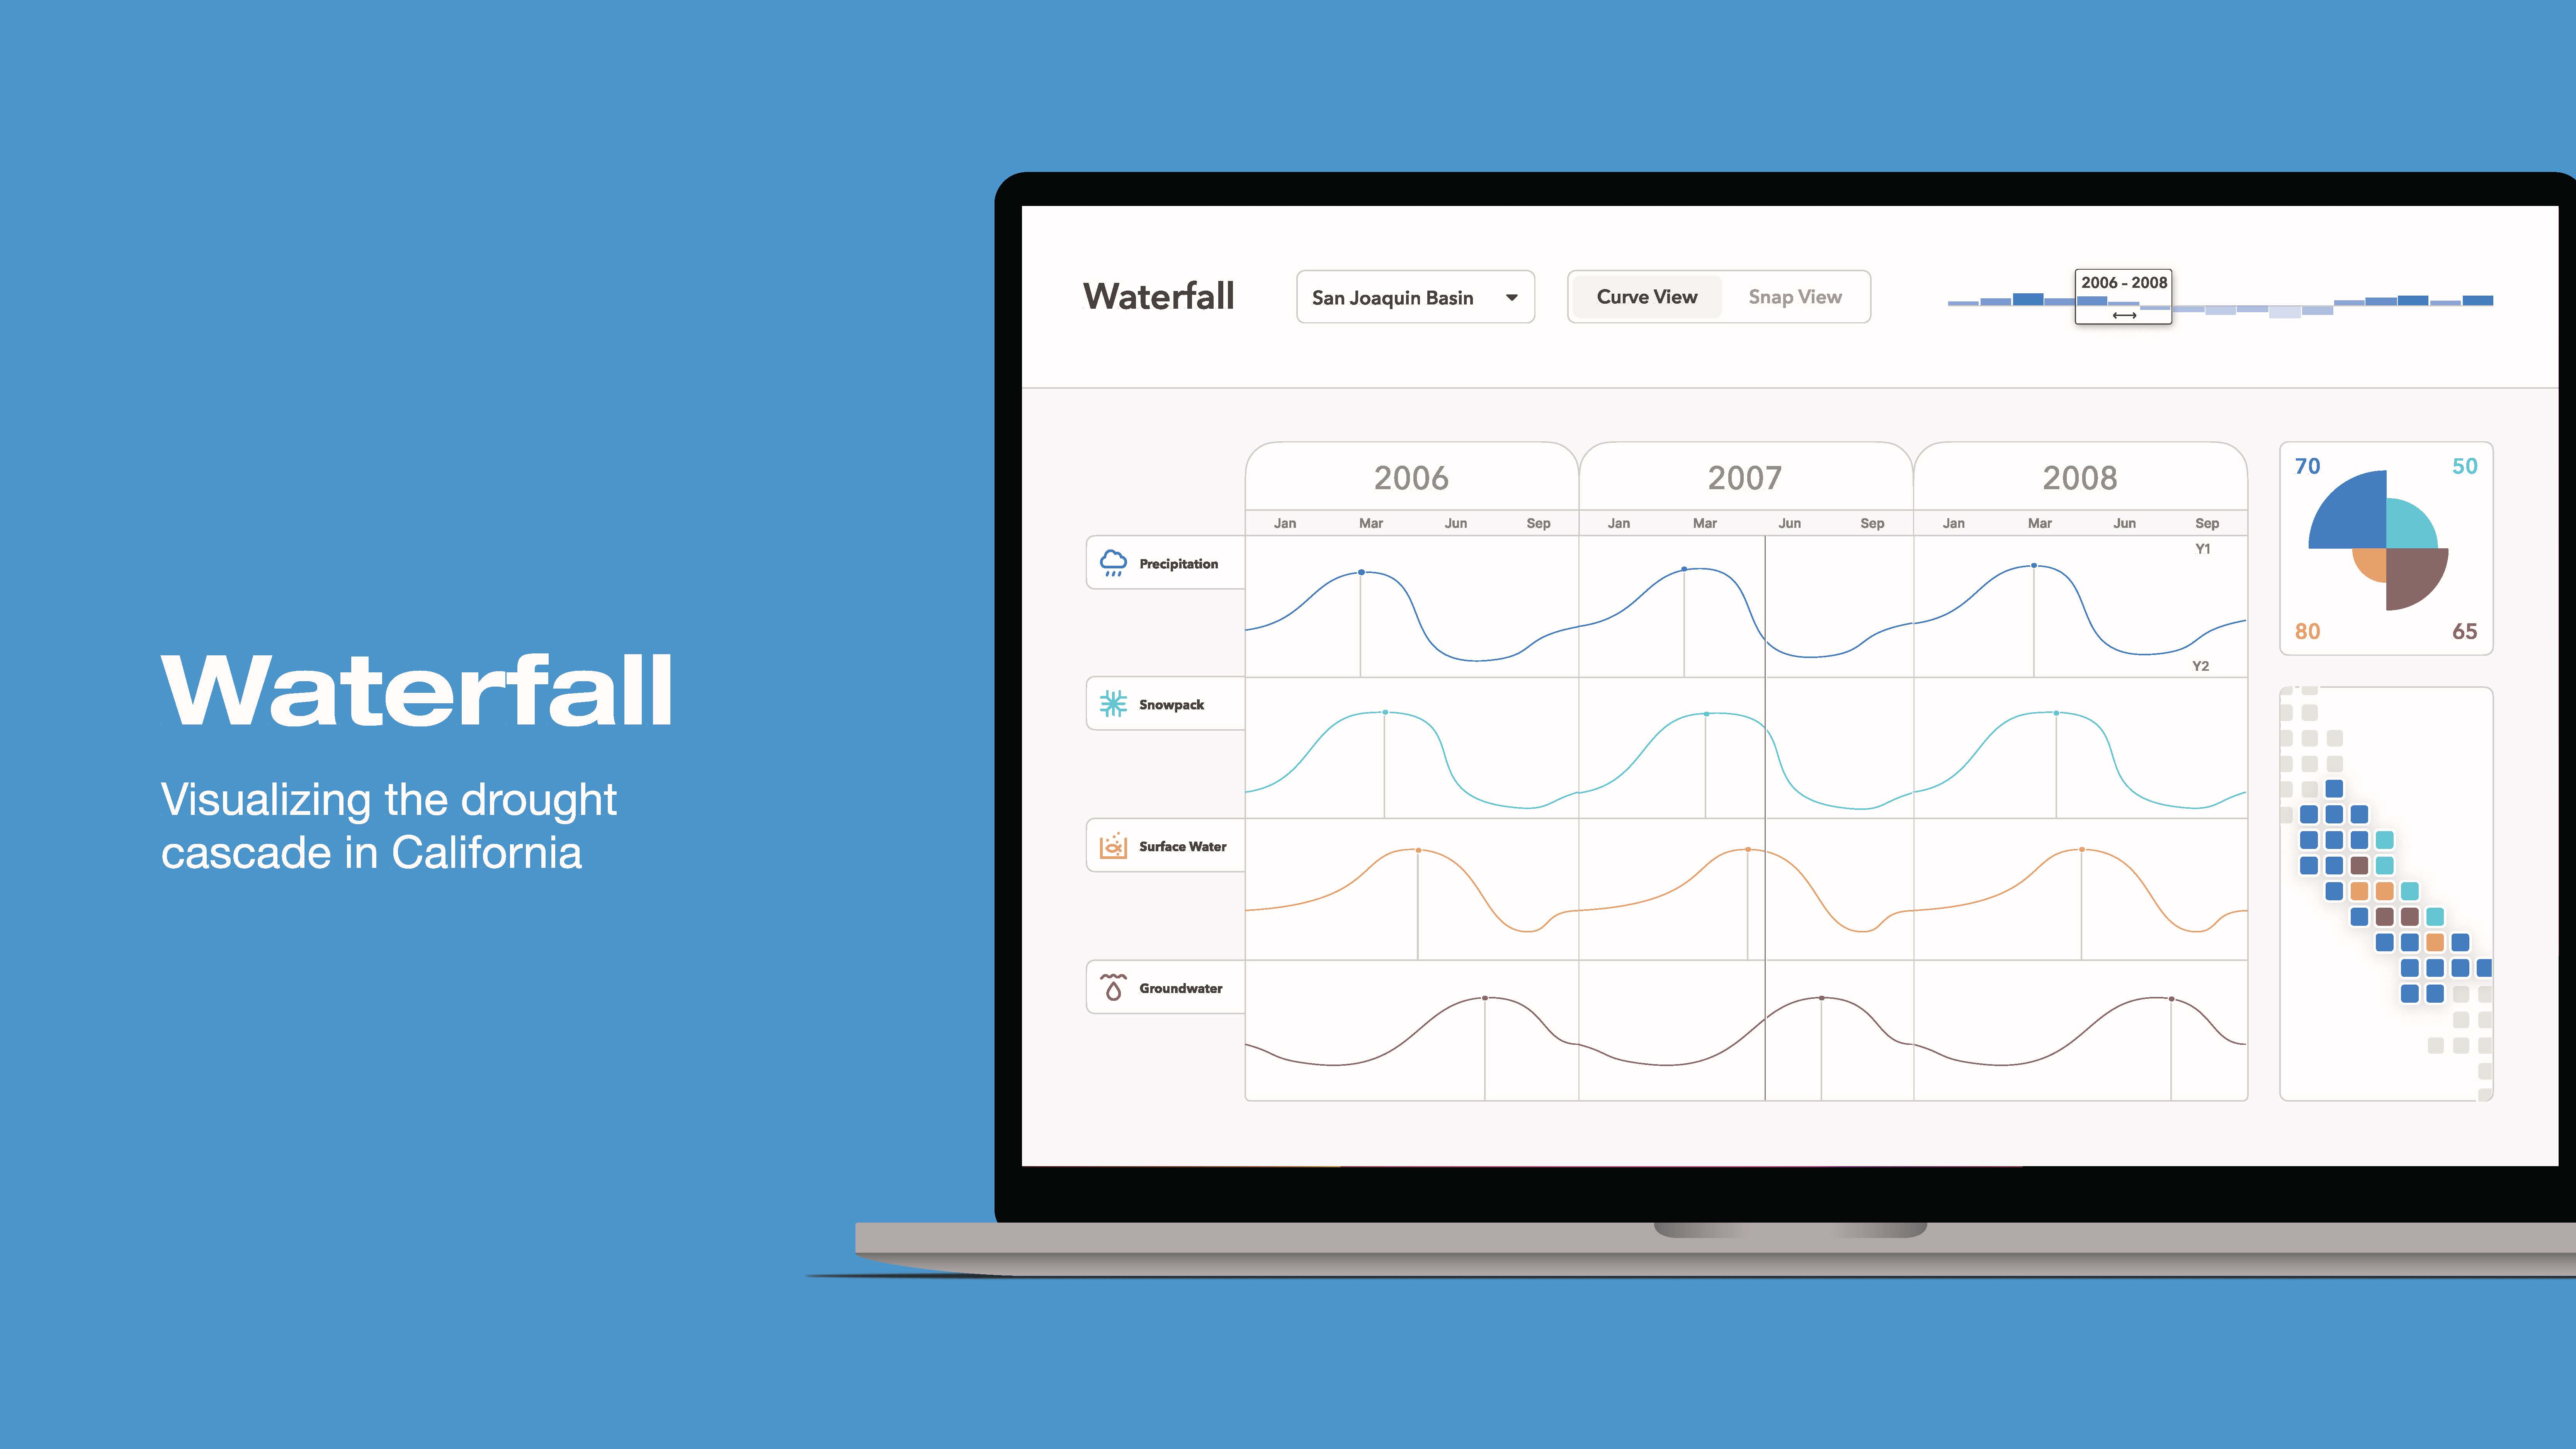
Waterfall: Visualizing the drought cascade in California
2021
data collection, data cleaning, contextual inquiry, wireframing, concept design, ux design, front-end development (p5.js)
data collection, data cleaning, contextual inquiry, wireframing, concept design, ux design, front-end development (p5.js)
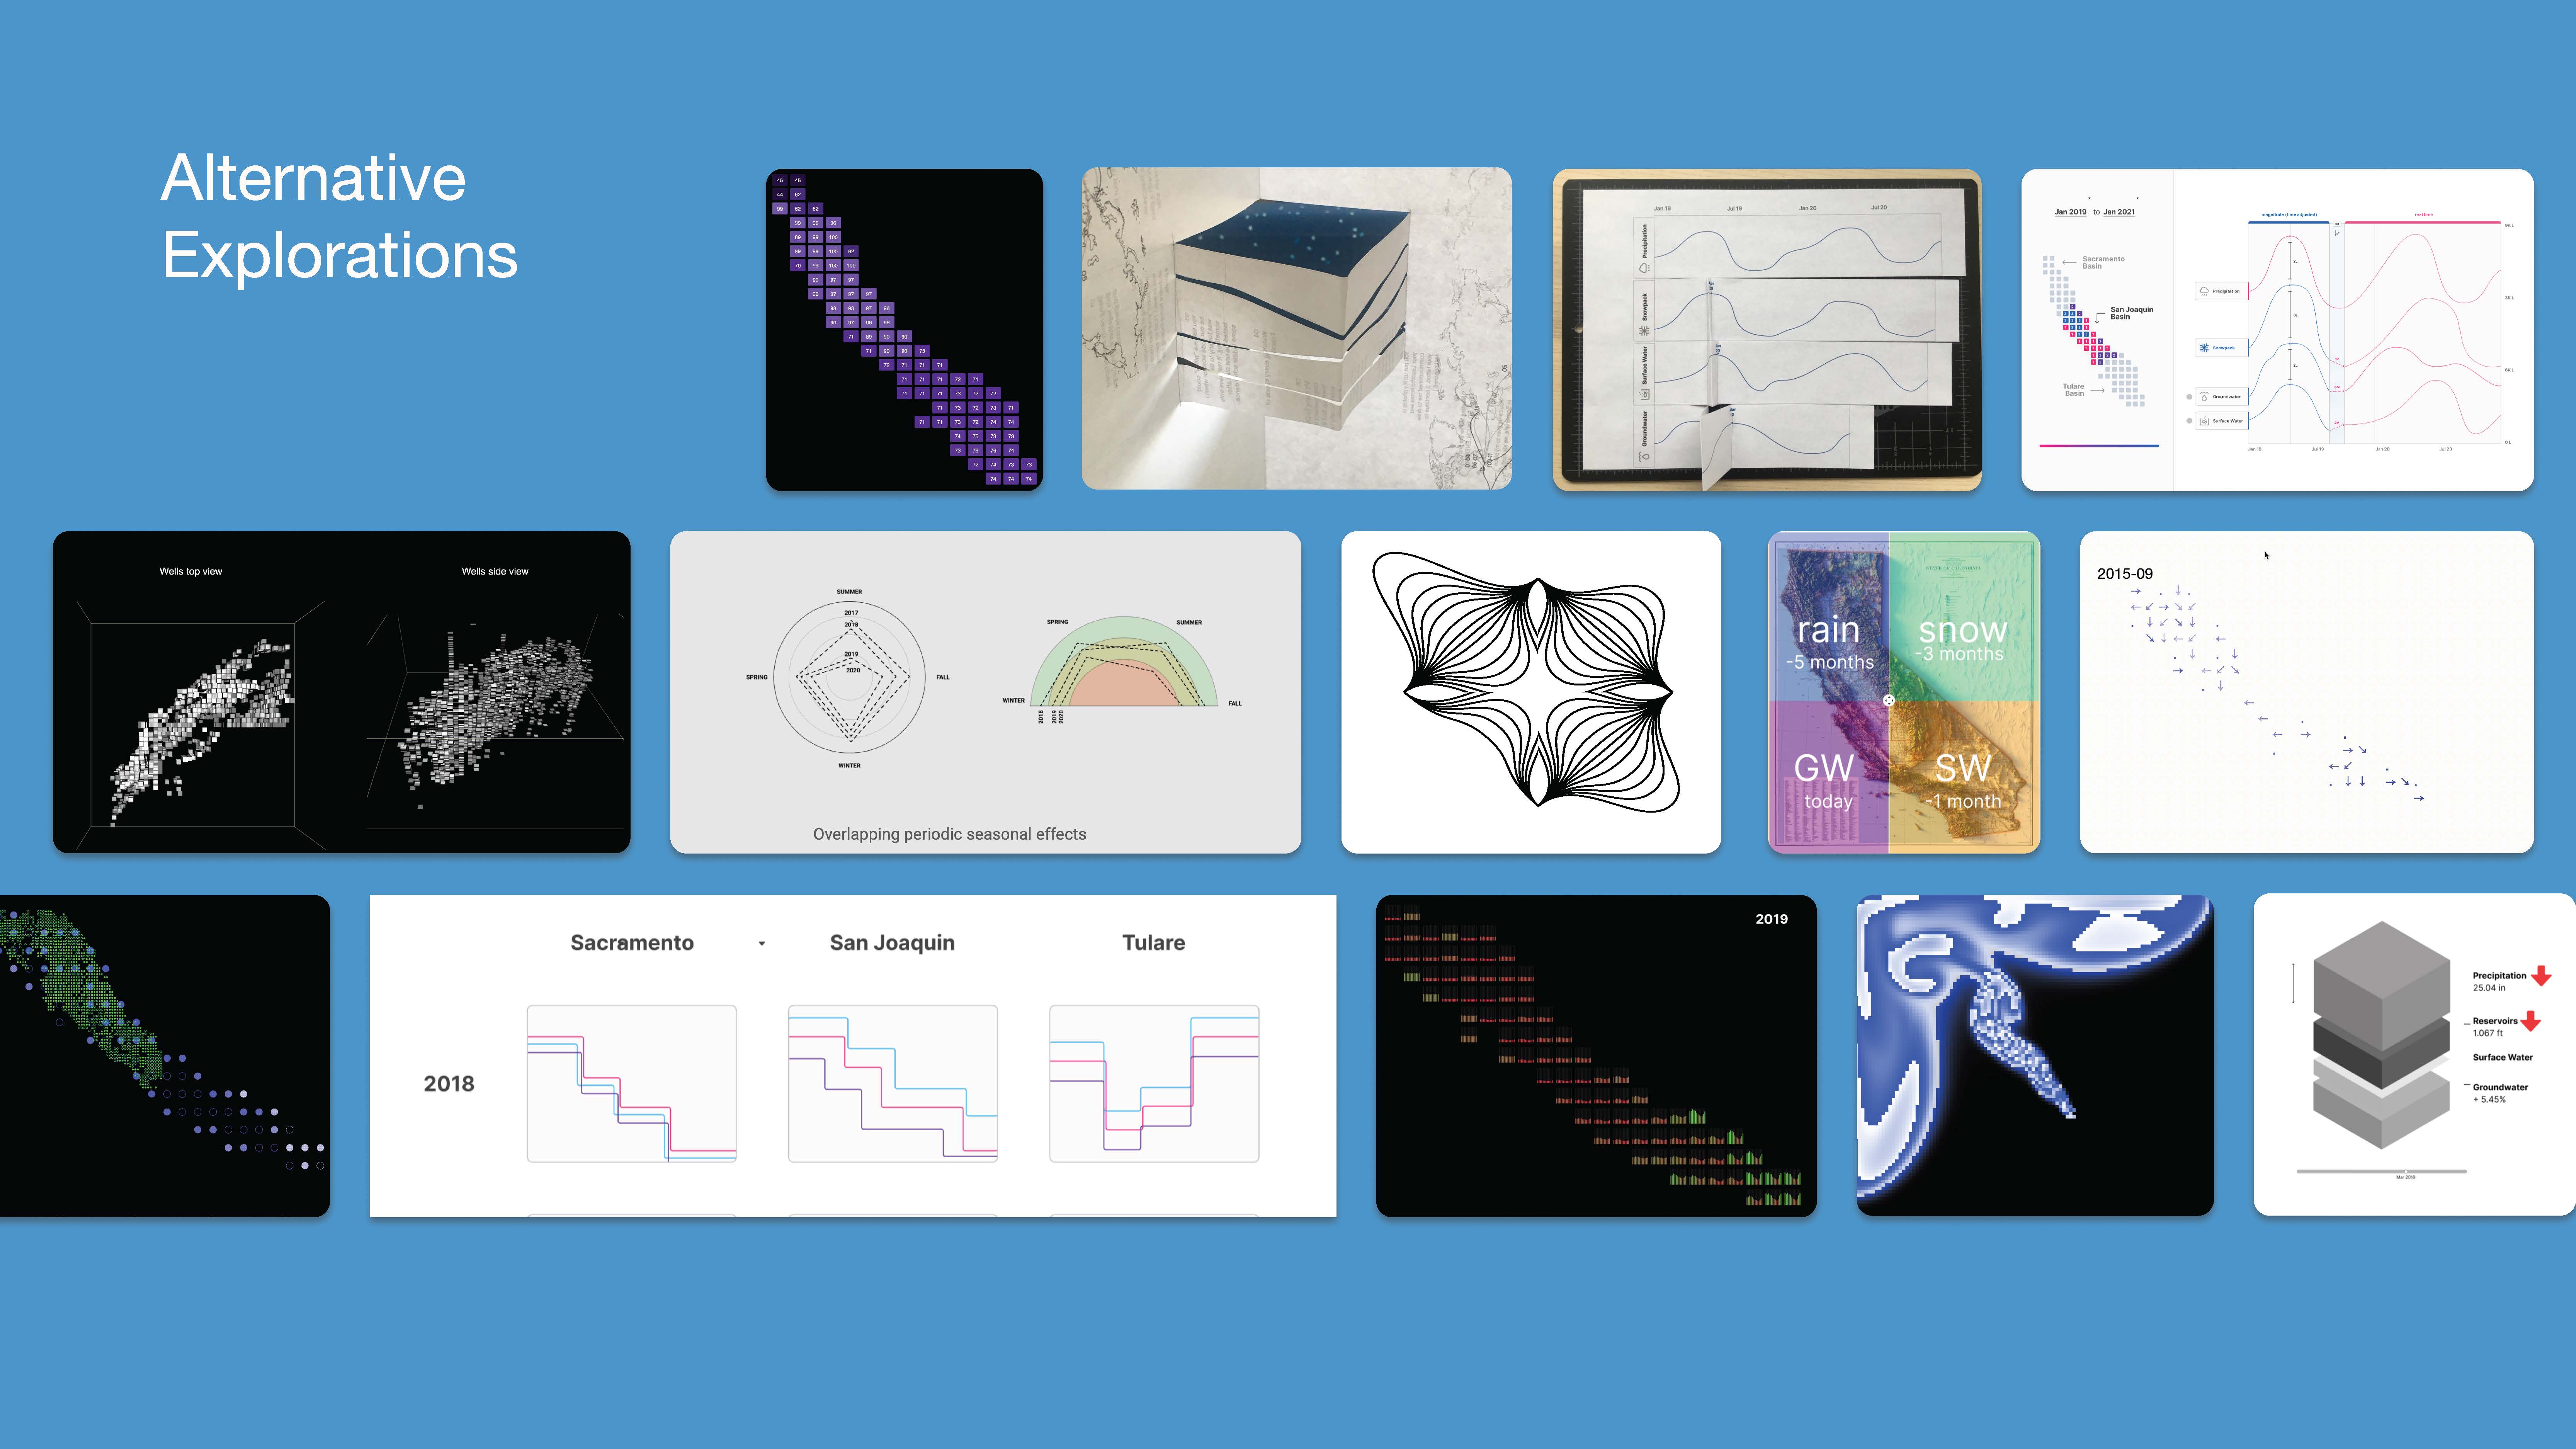
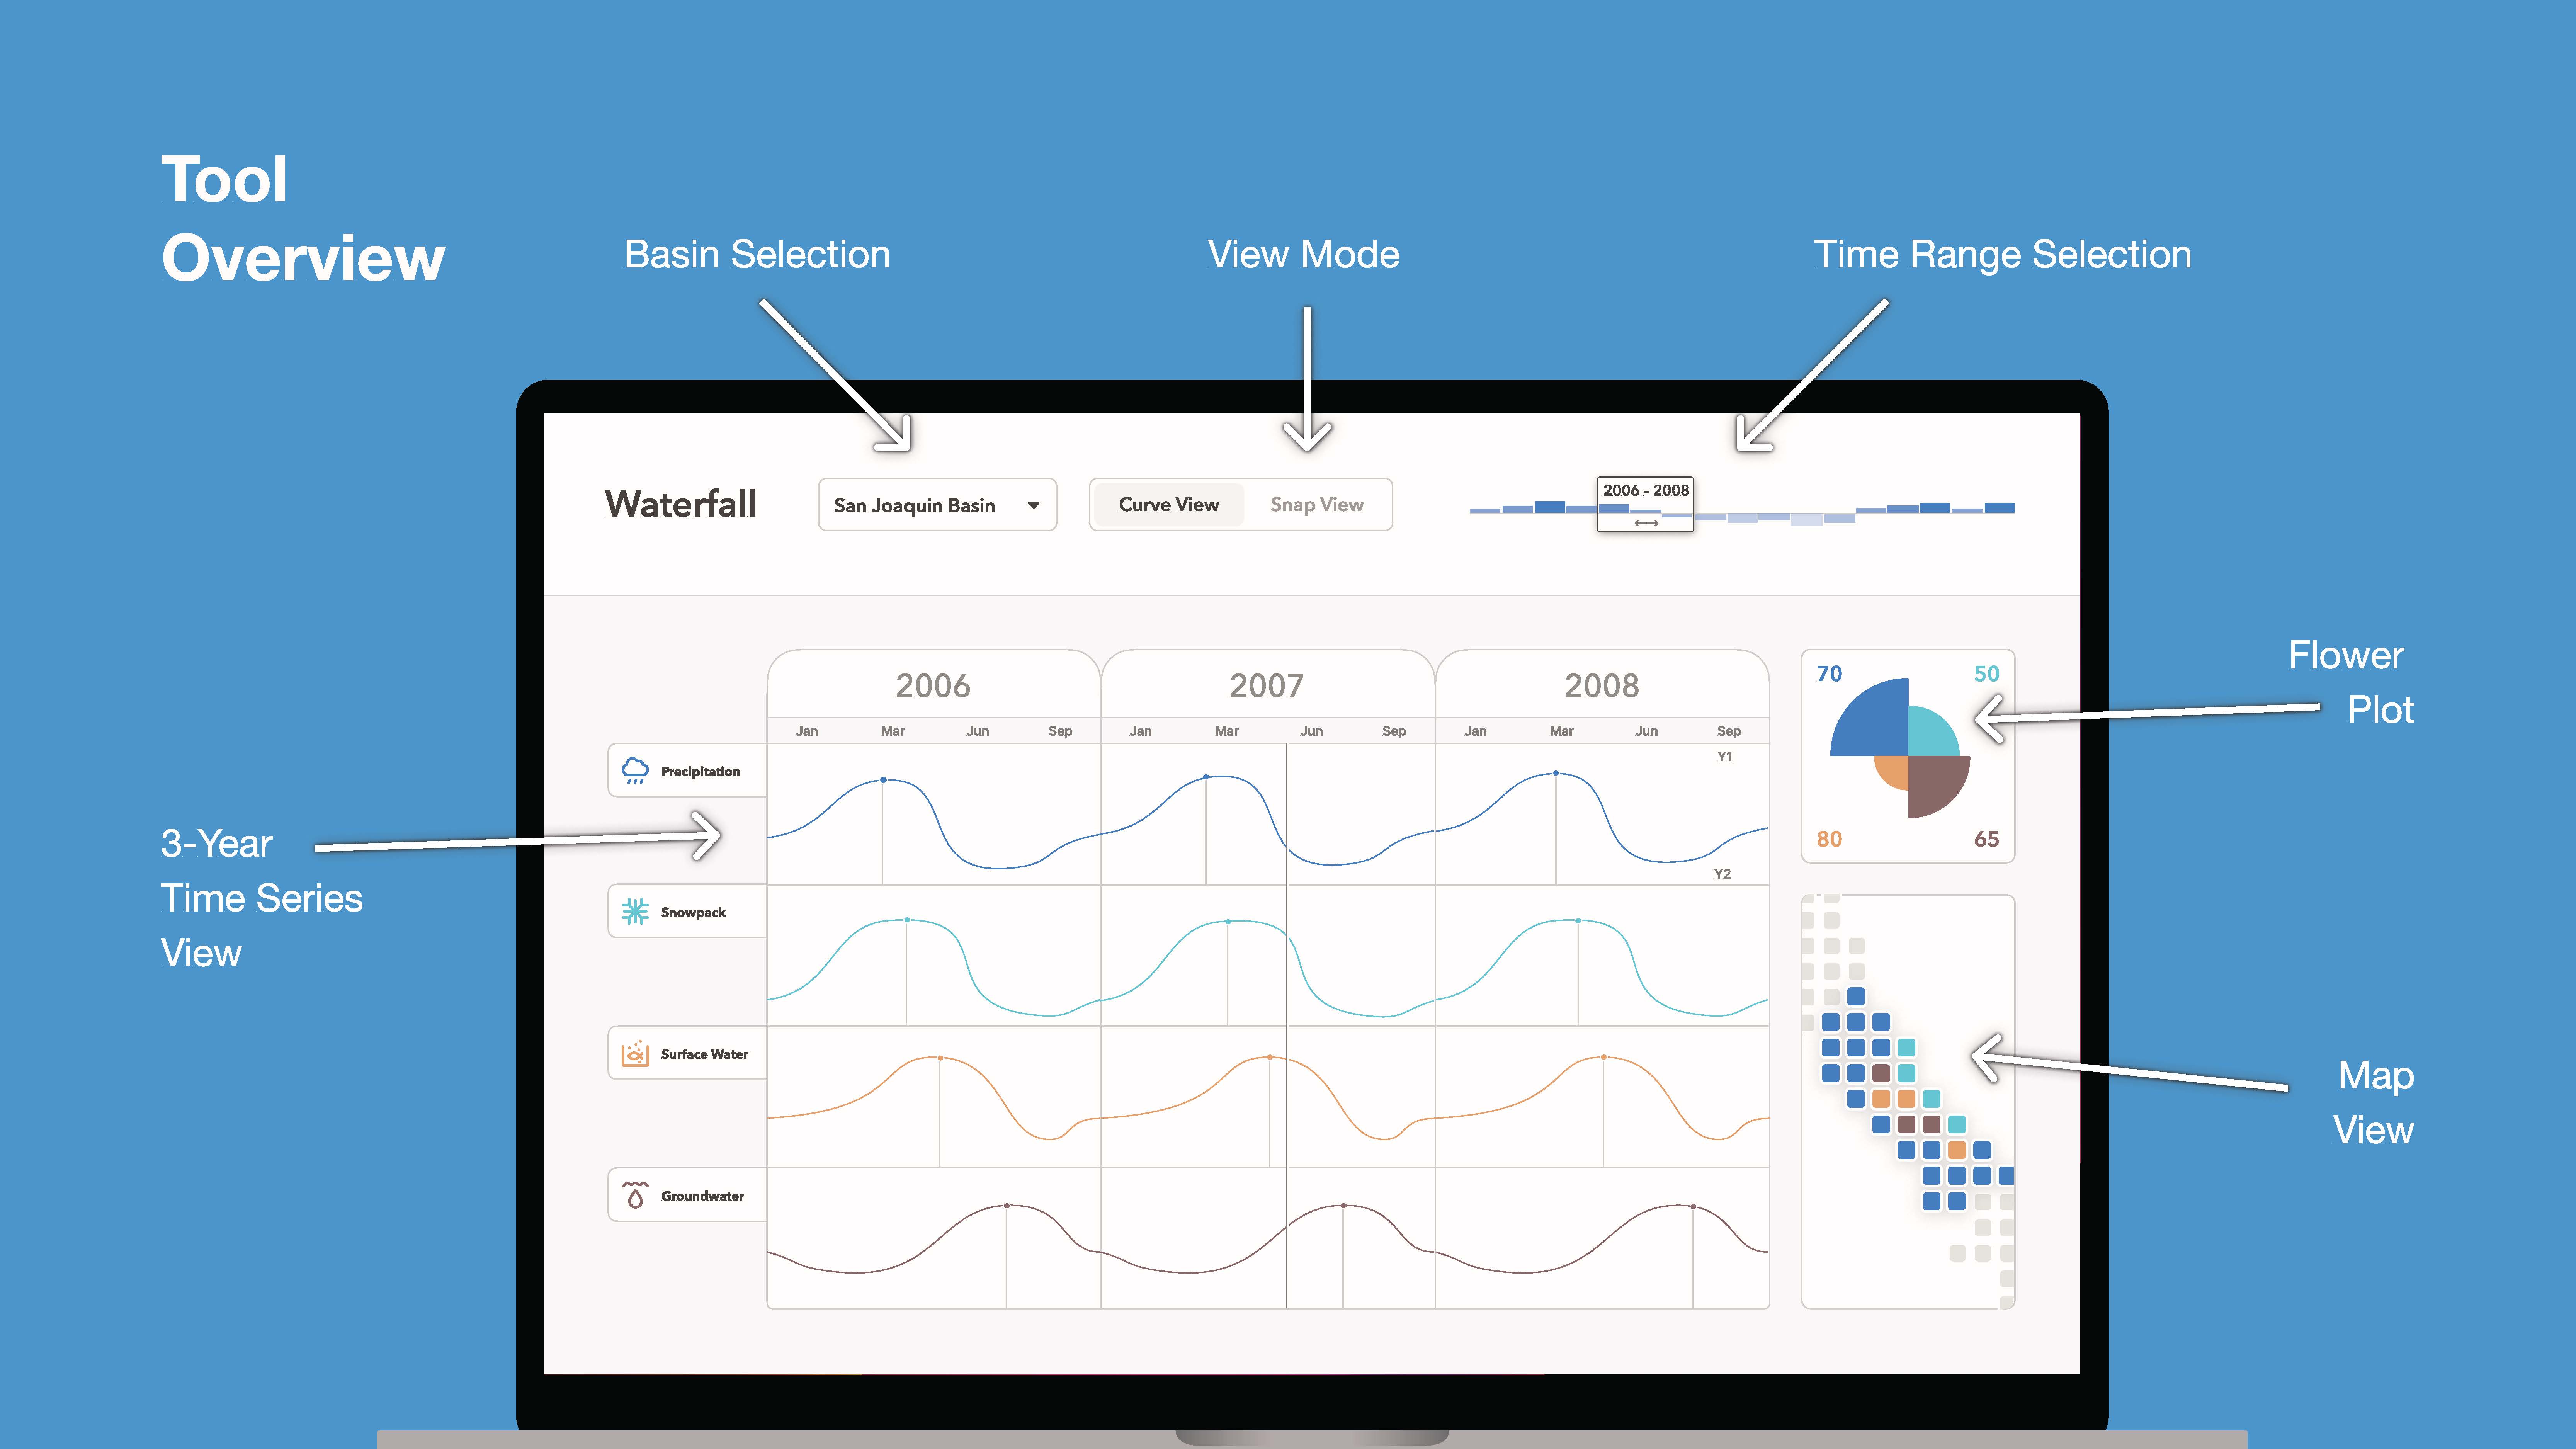
During the summer of 2021, I designed and built a tool for hydrology researchers at NASA’s Jet Propulsion Laboratory to understand the spatial and time-based patterns in California’s water system. Waterfall centralizes multiple layers of hydrology data, allowing users to understand changes across time, magnitude, and space, and build intuitions about relationships that inform future planning.
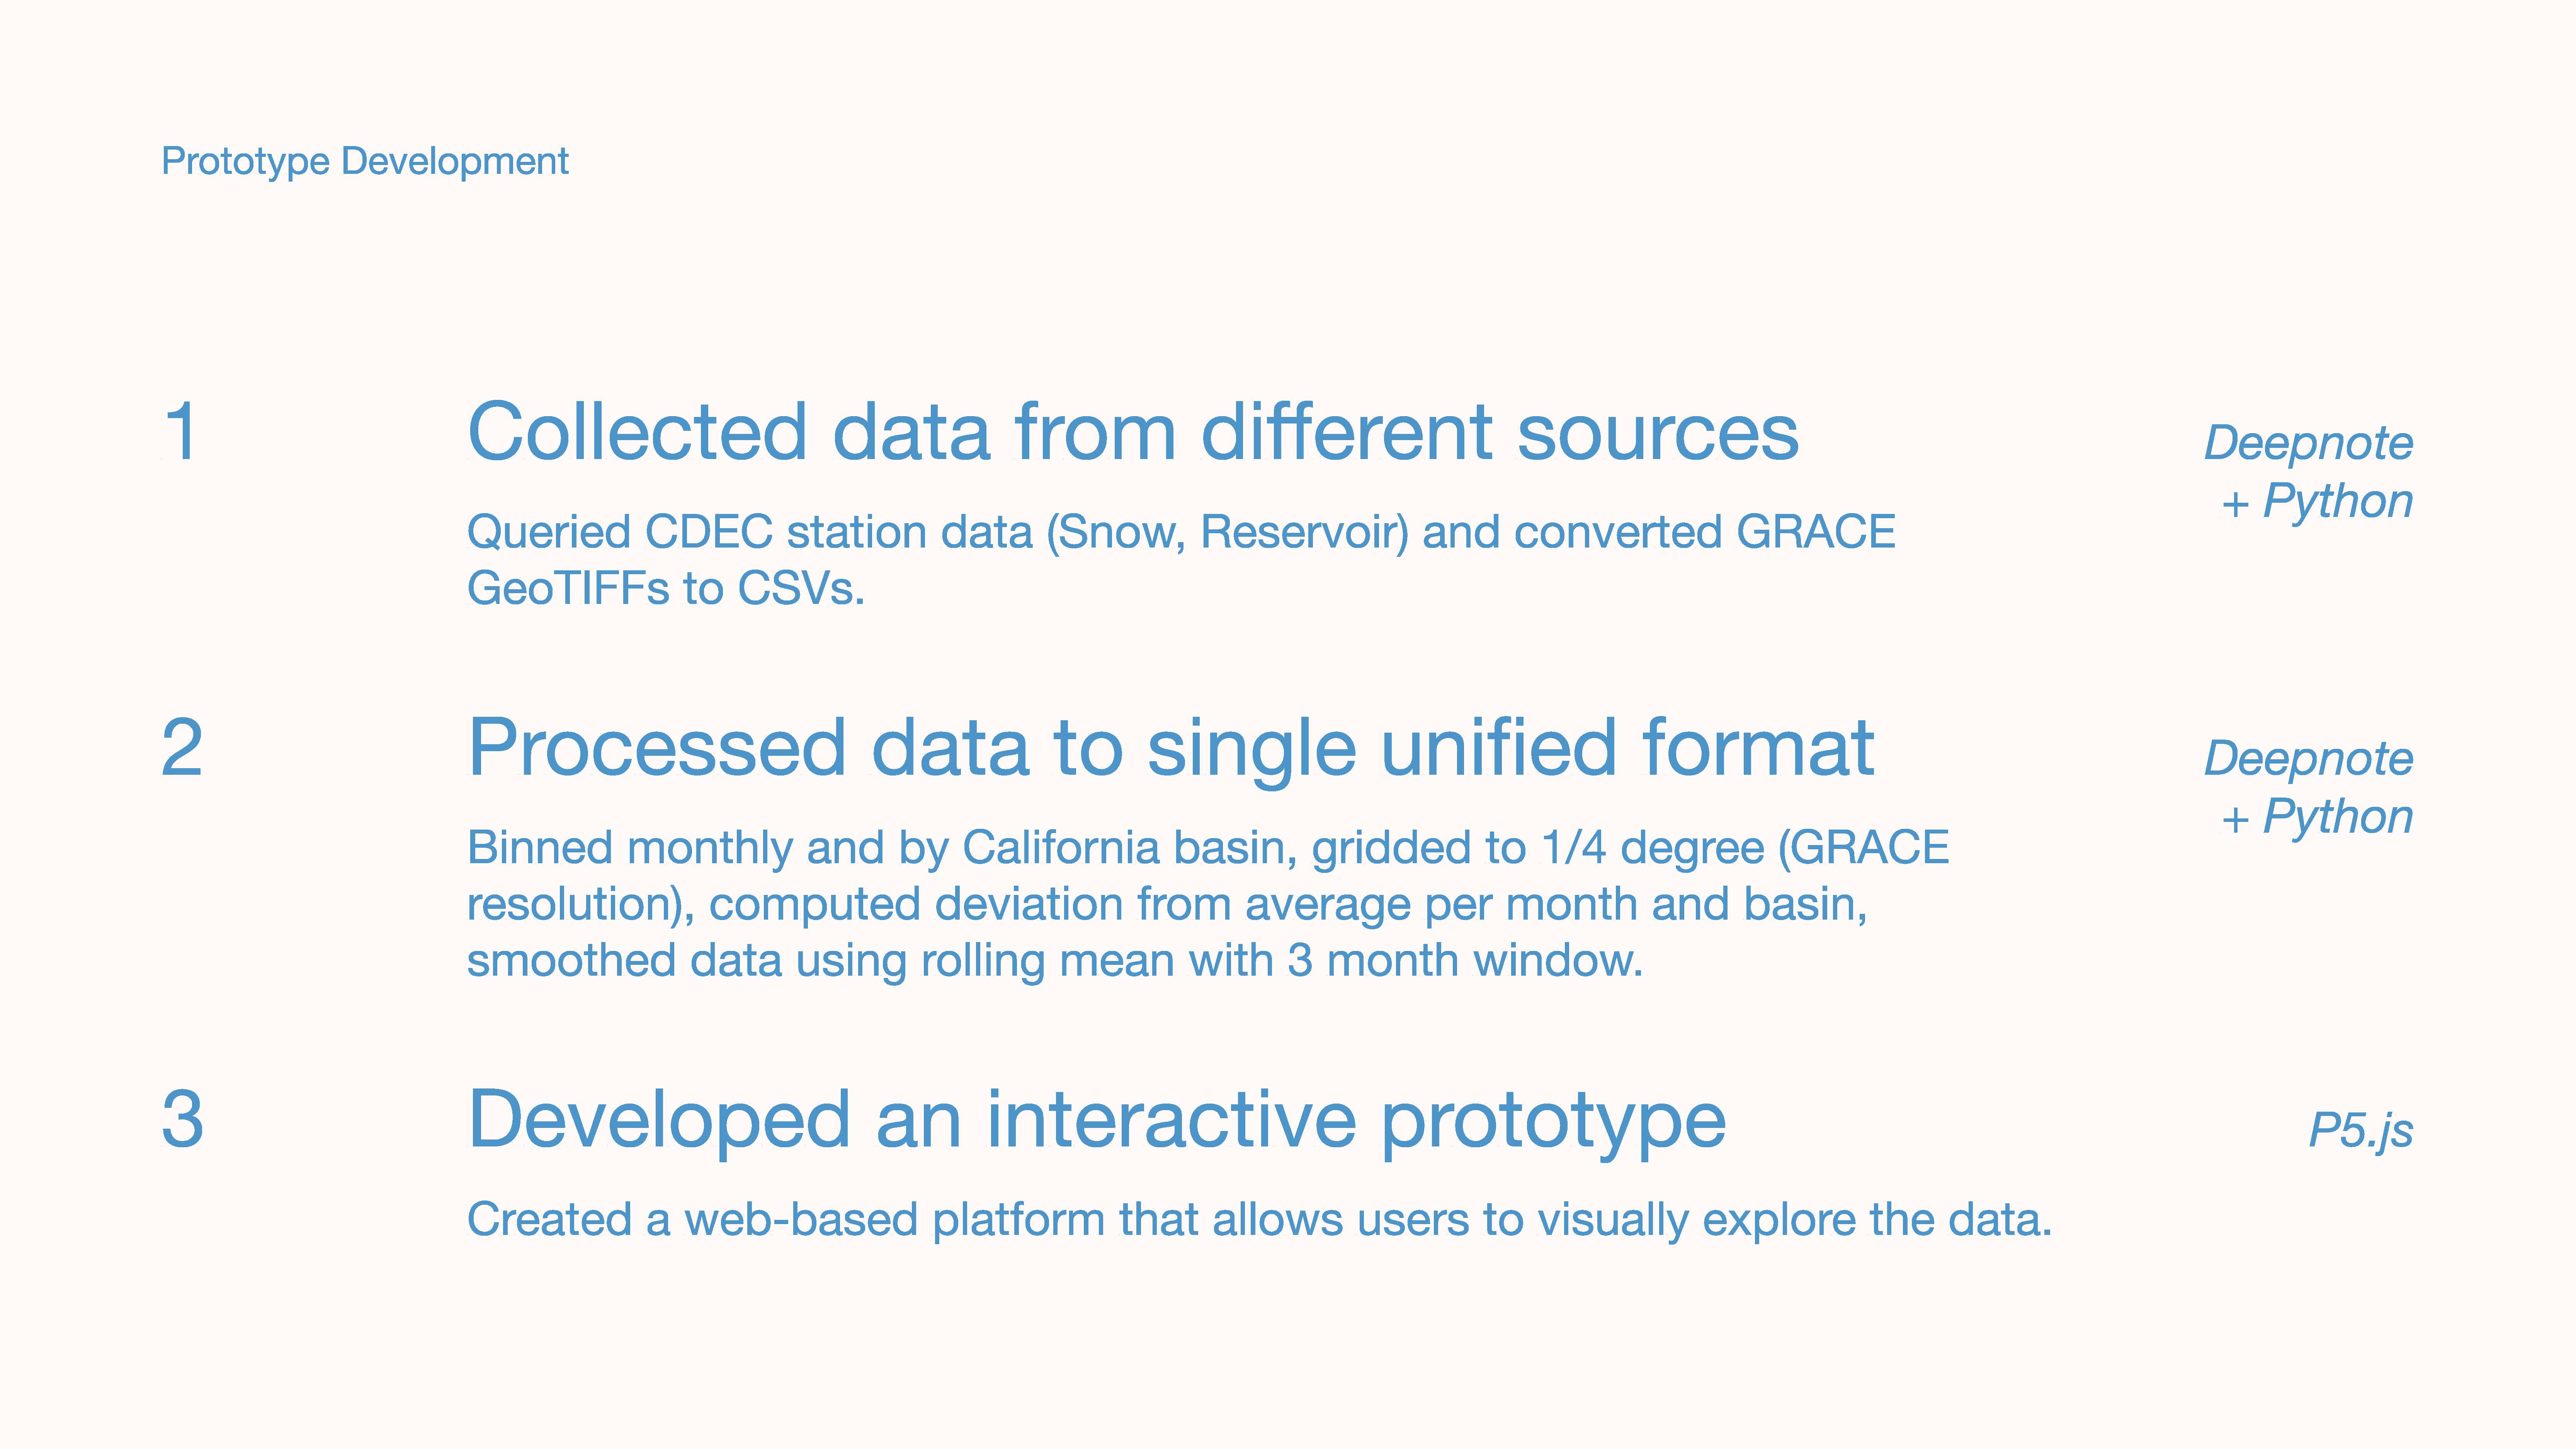
I handled the data pipeline in Python, and collaborated with another designer through the Data to Discovery Program to develop the visualization concept and build the front-end prototype using p5.js. You can explore the tool live.